Backtesting a MACD Trading Strategy in Seconds with BacktestZone & ChatGPT
- Nikhil Adithyan
- Mar 8
- 6 min read
A hassle-free no-code approach to effectively backtesting trading strategies

This is the second article of the “No-code Backtesting” series where we explore how different technical trading strategies can be backtested without having to write a single line of code using BacktestZone. If you missed the first article, you can read it here.
Today, we’re gonna backtest another majorly known strategy which is the MACD crossover strategy. We will first gain a firm background on the indicator along with the strategy we’re gonna backtest, and then, we’ll proceed to testing and evaluating it using BacktestZone.
The difference between the first article and this one is the inclusion of ChatGPT for better strategy evaluation, interpretation, and optimization. Now without further ado, let’s dive right into it!
MACD and The Crossover Strategy
Before moving on to MACD, it is essential to know what the Exponential Moving Average (EMA) means.
EMA is a type of Moving Average (MA) that automatically allocates greater weighting (nothing but importance) to the most recent data point and lesser weighting to data points in the distant past. For example, a question paper would consist of 10% of one mark questions, 40% of three mark questions, and 50% of long answer questions. From this example, you can observe that we are assigning unique weights to each section of the question paper based on the importance level (probably long answer questions are given more importance than the one-mark questions).
Now, MACD is a trend-following leading indicator that is calculated by subtracting two Exponential Moving Averages (one with longer and the other with shorter periods). There are three notable components in a MACD indicator.
MACD Line: This line is the difference between two given Exponential Moving Averages. To calculate the MACD line, one EMA with a longer period known as slow length, and another EMA with a shorter period known as fast length is calculated. The most popular length of the fast and slow is 12, 26 respectively. The final MACD line values can be arrived at by subtracting the slow length EMA from the fast length EMA. The formula to calculate the MACD line can be represented as follows:
MACD LINE = FAST LENGTH EMA - SLOW LENGTH EMA
Signal Line: This line is the Exponential Moving Average of the MACD line itself for a given period of time. The most popular period to calculate the Signal line is 9. As we are averaging out the MACD line itself, the Signal line will be smoother than the MACD line.
Histogram: As the name suggests, it is a histogram purposely plotted to reveal the difference between the MACD line and the Signal line. It is a great component to be used to identify trends. The formula to calculate the Histogram can be represented as follows:
HISTOGRAM = MACD LINE - SIGNAL LINE
The MACD Histogram is particularly useful in spotting trend reversals and momentum shifts.
The Trading Strategy
As I mentioned before, the strategy we’re gonna backtest is the classic MACD crossover strategy which generates signals as follows:
Enter the market if: the MACD line crosses above the Signal line
Exit the market if: the MACD line crosses below the Signal line
As simple as it is! Now that we have a good understanding of the indicator and the trading strategy, let’s put a stop to theory and get our hands dirty by backtesting the discussed strategy followed by evaluation and optimization.
Backtesting MACD Crossover Trading Strategy with BacktestZone
Before moving further, make sure that you have created an account on BacktestZone so that you can follow the article without any obstacles. If you don't have one, you can easily create it using this link: https://backtestzoneweb.accozen.co.in/
Step-1: Launch the app
There are two ways to launch the app. The first way is to head over to BacktestZone’s landing page (https://www.backtestzone.com/) and select the “launch app” button.

The second way is to directly head over to the app using this link: https://backtestzoneweb.accozen.co.in/
Step-2: Setting-Up Basic Parameters
In this step, we’ll insert all the preliminary inputs that are:
Selecting the exchange and stock
Specifying the backtesting period
Selecting the technical indicator
Let’s start with selecting the exchange and stock. We’re going to backtest our strategy on Apple’s stock.

The next step is to specify the backtesting period. For the sake of simplicity, we’ll stick to the default period which is 1 year. So the starting and ending dates are March 6, 2024, and March 6, 2025, respectively:

The last step of our basic setup is to choose the technical indicator. The platform currently has 30+ technical indicators from the basic ones like SMA, and MACD to advanced indicators like Vortex indicator, TRIX, Chande Forecast Oscillator, etc. Let’s stick to MACD for this article:

Step-3: Creating the Trading Strategy
The best thing about BacktestZone is that it gives a template to start from once the technical indicator is selected saving a ton of time. For example, if you choose SMA, the app will automatically fill in the specifications of the classic SMA 12,26 crossover strategy to give users a solid starting point.
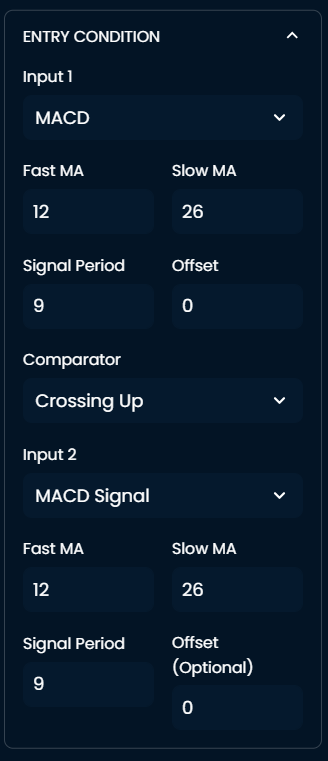
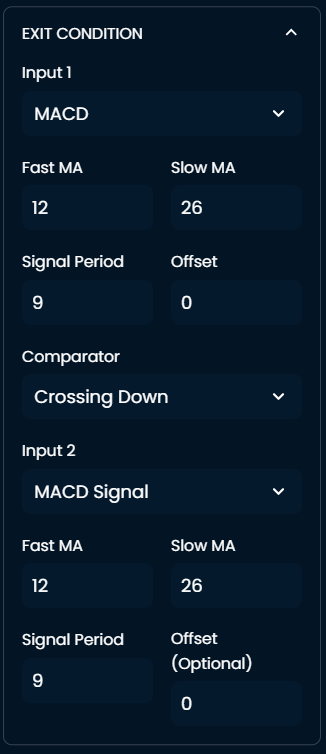
Since it’s MACD in our case, the app will fill in the entry and exit conditions as follows:
The template we have here is nothing but the classic MACD crossover strategy that we discussed earlier. The various numerical inputs are the lookback periods of the different MACD components. Again, to keep it simple, we’re going to stick to the default settings.
If you want to be creative, I encourage you to play around with the different parameters and all the fields are entirely customizable.
Now that we’ve created our strategy, hit the “Save & Backtest” button to run the backtest and obtain the results.

Strategy Evaluation with ChatGPT
BacktestZone provides users with a comprehensive evaluation report that consists of 60+ metrics, multiple charts, and trade logs. The metrics can be categorized into seven groups:
Key metrics
Statistical metrics
Performance metrics
Risk metrics
Consistency metrics
Risk-adjusted metrics
Tail risk metrics
Here’s a gist of BacktestZone’s results panel:

For the complete analysis of the report, it will take a lot of time which many traders can’t afford. Here’s where ChatGPT comes into play.
This is what we’re gonna do. First, we will save the strategy’s results as a CSV file using BacktestZone’s download feature:

Now, we will feed this CSV file to ChatGPT along with the strategy’s specifications in the prompt:

The response given by ChatGPT was really interesting. It first broke down all seven categories of evaluation metrics separately and then it finally gave somewhat of an overall verdict on the strategy’s performance. For the sake of brevity, I’m only going to showcase the final interpretation given by ChatGPT:

Isn’t this amazing?! It clearly highlighted the strategy’s nature, the risk exposure, the profit-generating level, and most importantly, for whom this strategy is a perfect fit. Also, the intuitive way of explanation is the cherry on the cake.
Strategy Optimization
Let’s take it one step further. While everything went really smoothly, our MACD crossover strategy still runs behind AAPL’s buy/hold performance in terms of the cumulative chart. This should not be overlooked and it also calls for strategy optimization.
ChatGPT can be of great help in strategy optimization where we can ask what kind of tuning should be made to the parameters in order to make the strategy more efficient. Let’s try it out:

ChatGPT gave me a list of things that can be modified or added but only a few were actually doable. Here’s where things get interesting.
I tried out the initial recommendation it gave. While it surpassed our MACD crossover strategy returns, it couldn't beat the buy/hold returns. After going back and forth with ChatGPT and playing around with the indicator’s different parameters, I was still not able to beat the buy/hold strategy.
This can be due to two reasons:
The platform’s restriction in adding multiple indicators
The strategy we chose might not be the perfect fit for the stock
These are factors that cannot be modified for optimization. The only solution is to change the entire strategy or go with a different stock that’s apt for our MACD strategy but it would be out of the scope.
Conclusion
This has been an interesting ride and pretty new for me. Being used to coding, it indeed feels somewhat restricted with no-code tools but the amount of time it saves compensates for that limitation.
So far, we’ve only scratched the surface of no-code for algo trading. Currently, BacktestZone is in its very initial stages but I’m confident that with the addition of more advanced features and AI integration, it will become a must-have in a trader’s toolkit.
With that being said, you’ve reached the end of the article. Hope you learned something new today and stay tuned for the next article of this series. Thank you for your time.


